NHL Playoffs First-Round Streaks, Trends and Series Previews
By Sascha Paruk in NHL Hockey
Updated: March 25, 2020 at 3:26 pm EDTPublished:
- The 2019 NHL playoff bracket is set and the first round will start Wed., Apr. 10th
- Get a breakdown of the odds for each series, along with the betting trends for each team and the NHL as a whole
- Two teams with home-ice advantage are betting underdogs in round one
Heading into the first round of the postseason (Wed., Apr. 10), the Tampa Bay Lightning are massive favorites to win the 2019 Stanley Cup, sitting at +180 at most sportsbooks. Those are incredibly short odds for the NHL, where regular-season success is not a great indicator of playoff success (more on this below).
But this year’s Lightning are seen as a cut above for good reason. They tied an NHL record with 62 wins, and their +103 goal difference was the best mark since 2005-06 Ottawa Senators.
Below, we dive into the odds and trends for each first-round playoff series, but first, some general streaks and trends for the NHL playoffs.
General NHL Playoff Trends and Streaks
| NHL Playoff Trend/Streak | Result/Number |
|---|---|
| Last Presidents Trophy-Winner to Win Stanley Cup | 2012-13 Blackhawks |
| Consecutive Stanley Cup-Winners from Eastern Conference | 3 |
| Last Hart Trophy-Winner to Win Stanley Cup | Martin St. Louis, Lightning (2004) |
The Presidents Trophy curse is not as pronounced as some curses in sports, but there is little correlation between being the best team in the regular season and winning the Stanley Cup. Since the trophy was first awarded in 1984-85, only eight of 33 winners (24%) have gone onto win the cup.
That’s much higher than random chance — with 16 teams in the playoffs, each team would have a 6.3% chance if all else was equal — but considerably lower than the NBA, where it’s happened 15 times in the last 33 years.
First-Round Trends and Streaks: Last Five Seasons
| NHL Playoff Trend/Streak | Record/Number |
|---|---|
| Division Winners vs Wild Cards (First Round) | 14-6 |
| #2 Seeds vs #3 Seeds (First Round) | 12-8 |
| Average Length of First-Round Series | 5.7 Games |
| Number of Four-Game Sweeps | 6 (15%) |
When it comes to Hart Trophy winners in the playoffs, it’s been 15 years since the regular-season MVP etched his name on the cup. While this year’s Hart hasn’t been officially handed over to Nikita Kucherov yet, the 2019 Hart Trophy odds showed that it was a done deal over a month ago. The dynamic Russian led the league with 128 points, 30 more than the second-highest scorer on Tampa (Steven Stamkos, 98).
Eastern Conference
Columbus Blue Jackets vs Tampa Bay Lightning
Series Odds
| Team | Odds |
|---|---|
| Blue Jackets | +315 |
| Lightning | -375 |
Tampa Bay is the biggest favorite of the opening round, which shouldn’t be surprising given that their +180 odds to win the cup carry a 35.7% implied probability. The next-closest team in the Stanley Cup futures is Calgary at +700, which is just 12.5% (or 23.2% lower than Tampa).
The Blue Jackets made a ton of moves at the deadline to bolster a solid but underperforming roster, adding top-six forward Matt Duchene and Ryan Dzingel, depth defenseman Adam McQuaid, and backup goalie Keith Kinkaid. The moves did enough to get CBJ into the playoffs, but they have never been out of the first round in their 18-year history and went 0-3-0 vs Tampa in the regular season.
Blue Jackets vs Lightning Betting Trends
| Trend | Blue Jackets | Lightning |
|---|---|---|
| Head-to-Head Record | 0-3-0 | 3-0-0 |
| Moneyline Record | 47-35 | 62-20 |
| Over/Under Record | 31-45-6 | 44-35-3 |
| Puckline Record | 43-39 | 41-41 |
Carolina Hurricanes vs Washington Capitals
Series Odds
| Team | Odds |
|---|---|
| Hurricanes | +128 |
| Capitals | -148 |
The defending champion Capitals are only modest -148 favorites against Carolina. That says more about bettors’ confidence in the Canes than doubts about the Caps. Carolina has some of the possession and shot metrics in the NHL, with a 55.13% Corsi (1st) and 54.93% Fenwick (1st). Washington finished 20th in Corsi and 19th in Fenwick. For those unfamiliar with advanced stats, those stats mean that Carolina is generating a lot more shots than they’re giving up.
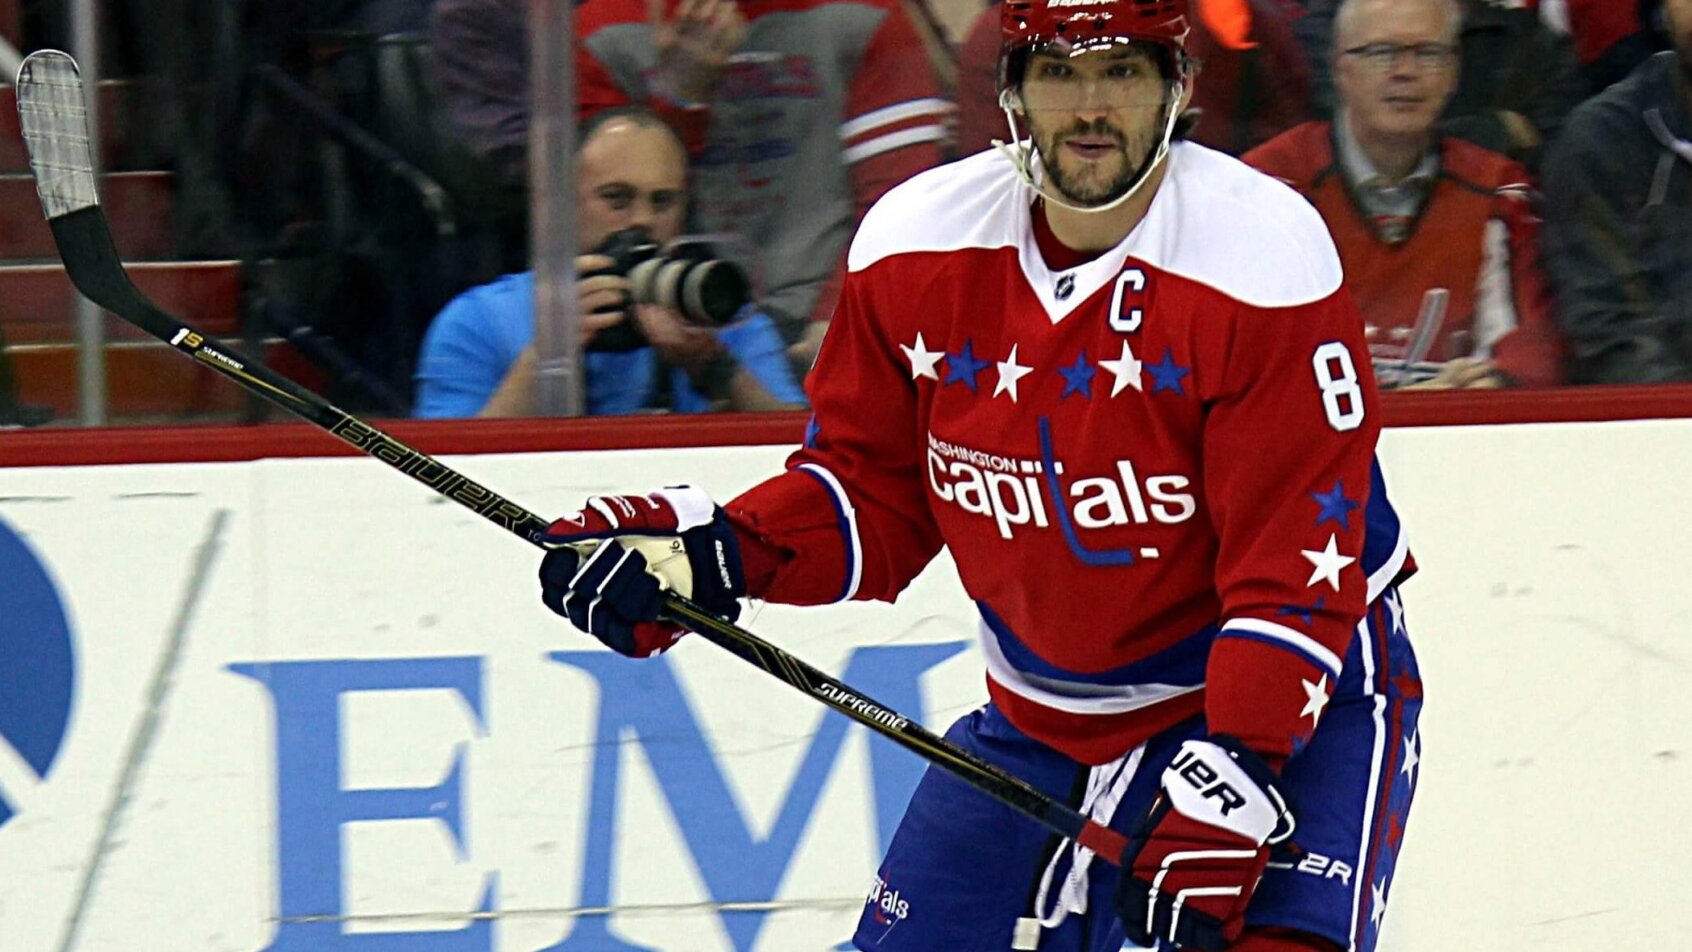
The Canes are generating higher-quality chances, too. They finished fourth in High-Danger Scoring Chances Percentage, while Washington was 29th. Yet Washington finished with 33 more goals (278-245). Their snipers were burying their chances, finishing second in the NHL in shooting percentage (10.99%). Alex Ovechkin hit 50 for the eighth time and also won his eighth Rocket Richard trophy.
Savvy bettors know that shooting percentage is a stat that tends to regress to the mean over time, which is why the odds are closer than you might think.
The obvious retort for Capitals fans is goaltending: Braden Holtby has a lifetime .929 SV% in the playoffs and closed the season strong, posting a .920 SV% after the All-Star break. But don’t sleep on Petr Mrazek; his 4.51 Goals Save Above Average (GSAA) was well ahead of Holtby’s 1.79 GSAA in the regular season, and he has a 9.27 SV% in 11 career playoff games.
Betting Trends
| Trend | Hurricanes | Capitals |
|---|---|---|
| Head-to-Head Record | 0-3-1 | 4-0-0 |
| Moneyline Record | 46-36 | 38-34 |
| Over/Under Record | 34-46-2 | 41-38-3 |
| Puckline Record | 38-44 | 38-44 |
Toronto Maple Leafs vs Boston Bruins
Series Odds
| Team | Odds |
|---|---|
| Maple Leafs | +125 |
| Bruins | -145 |
Toronto’s struggles against Boston are well documented. The Bs bounced the Buds in an epic seven-game thriller last year. Both teams are pretty similar this year, with the obvious exception of Toronto adding 47-goal scorer John Tavares. Will that be enough to make the difference?

The Bruins have better shot/possession metrics (6th in Corsi, 5th in Fenwick versus 8th in Corsi, 11th in Fenwick for Toronto) while the Leafs are shooting at a higher clip, sitting at 10.45% (6th) versus 9.59% (13th) for Boston.
The battle in net should be a good one. Frederick Anderssen posted a 14.48 GSAA for Toronto, while Jaroslav Halak was right behind him at 14.37 GSAA for Boston.
Betting Trends
| Trend | Maple Leafs | Bruins |
|---|---|---|
| Head-to-Head Record | 1-3-0 | 3-1-0 |
| Moneyline Record | 46-36 | 49-33 |
| Over/Under Record | 40-38-4 | 34-44-4 |
| Puckline Record | 35-47 | 41-41 |
Pittsburgh Penguins vs New York Islanders
Series Odds
| Team | Odds |
|---|---|
| Penguins | -146 |
| Islanders | +126 |
The Islanders are substantial underdogs despite have home-ice advantage. There are myriad reasons for that. First and foremost: Sidney Crosby, Evgeni Malkin, Phil Kessel, and Kris Letang have 11 Stanley Cups between them.
Second, the Islanders went a pedestrian 11-8-0 down the stretch, letting the division lead slip to Washington in the process. The Penguins, meanwhile, finished red-hot, with an 11-4-4 record in March and April.

The Islanders led the league in SV% (92.47) but there are still ample questions about Robin Lehner going into the postseason. He only has two career playoff games under his belt, while Matt Murray has 44 and just came off arguably the best regular season of his career. Pittsburgh’s deficit in net may not be nearly as pronounced as New York’s deficit up front.
Betting Trends
| Trend | Penguins | Islanders |
|---|---|---|
| Head-to-Head Record | 2-1-1 | 2-1-1 |
| Moneyline Record | 44-38 | 48-35 |
| Over/Under Record | 35-41-6 | 26-51-5 |
| Puckline Record | 39-43 | 43-39 |
Western Conference
Colorado Avalanche vs Calgary Flames
Series Odds
| Team | Odds |
|---|---|
| Avalanche | +200 |
| Flames | -240 |
Calgary was quietly the second-best team in the NHL this season, posting a +62 goal difference (which would have led the league last year) including a Western Conference-leading 289 goals for. They wound up fourth in both Corsi and Fenwick and will be facing a Colorado team that was mid-pack in both stats.
This is one series where home-ice should be huge. Calgary was a phenomenal 26-10-5 at the Saddledome (again the best in the West), while the Avs were just 17-16-8 outside of Denver. That’s the fewest wins of any team in the playoffs.
Mikko Rantanen looking strong in red non-contact sweater. Update to come by strong chance he’ll play in Game 1. #Avs vs. #flames
— Mike Chambers (@MikeChambers) April 8, 2019
Throw in the fact that Mikko Rantanen (87 points in 74 games) is still not healthy, and the top-heavy Avalanche will have a difficult time matching up with a deep Calgary roster. Their big hope will be that the Flames’ goalie tandem (Mike Smith, David Rittich) falters. Calgary goalies had a combined 90.31 SV% in the regular season, 21st in the league. Colorado finished 12th at 90.68 SV%.
Betting Trends
| Trend | Avalanche | Flames |
|---|---|---|
| Head-to-Head Record | 0-2-1 | 3-0-0 |
| Moneyline Record | 38-44 | 50-32 |
| Over/Under Record | 41-41 | 41-37-4 |
| Puckline Record | 42-40 | 43-39 |
Dallas Stars vs Nashville Predators
Series Odds
| Team | Odds |
|---|---|
| Stars | +160 |
| Predators | -180 |
Both of these teams finished strong. Dallas was 11-5-2 in March and April, while Nashville went 10-5-1 to sneak past Winnipeg and win the Central.
This is another series where the underlying possession metrics are motivating the odds. Nashville has been great at generating chances (8th in Fenwick vs 22nd for Dallas) and is shooting just 8.81% (21st). That said, Dallas is generating more high-danger chances by comparison (9th vs 18th in HDCF%).
In net, Dallas is backstopped by Ben Bishop, who will be a Vezina finalist and led the Stars to the second-best SV% in the NHL (92.28%).
Taking these teams as a whole, it’s hard to figure out why Nashville is such a short favorite. This series projects to see a number of low-scoring, one-goal games and at least a couple of overtimes.
Betting Trends
| Trend | Stars | Predators |
|---|---|---|
| Head-to-Head Record | 2-1-2 | 3-2-0 |
| Moneyline Record | 43-39 | 47-35 |
| Over/Under Record | 24-50-8 | 33-46-3 |
| Puckline Record | 43-39 | 32-50 |
Vegas Golden Knights vs San Jose Sharks
Series Odds
| Team | Odds |
|---|---|
| Golden Knights | -110 |
| Sharks | -110 |
Last season’s playoff darlings are even money against the Sharks in round one. Without Marc-Andre Fleury, Vegas struggled to close the season (14-13-3 since February). But San Jose was only 9-8-1 in its last 18 games, as well.
Vegas leads the NHL in High-Danger Scoring Chances Percentage, while San Jose is a respectable 7th.

The issue for San Jose this year has been in net. Martin Jones has a -22.87 GSAA, second-worst in the entire league. Fleury didn’t have his best year, but was still above average and showed his potential to steal, not just games, but entire series last season.
Betting Trends
| Trend | Golden Knights | Sharks |
|---|---|---|
| Head-to-Head Record | 2-1-1 | 2-2-0 |
| Moneyline Record | 43-39 | 45-36 |
| Over/Under Record | 37-41-4 | 47-33-2 |
| Puckline Record | 32-50 | 33-49 |
St. Louis Blues vs Winnipeg Jets
Series Odds
| Team | Odds |
|---|---|
| Blues | -125 |
| Jets | +105 |
Along with the Islanders, the Jets are the only other team with home-ice advantage that’s an underdog. The odds are flipped because of how these teams played in the back half of the season. The Blues went 20-6-3 since the end of January. The Jets were just 14-14-3.
The Blues were also an incredibly solid 21-13-7 away from home. Remember that those 7 OT and shootout losses on the road won’t mean anything in the playoffs. There is no 3-on-3 OT or shootouts. They play 5-on-5 until someone breaks the tie.
Betting Trends
| Trend | Blues | Jets |
|---|---|---|
| Head-to-Head Record | 1-2-1 | 3-1-0 |
| Moneyline Record | 45-37 | 47-35 |
| Over/Under Record | 34-44-4 | 41-33-8 |
| Puckline Record | 40-42 | 32-50 |

Managing Editor
Sascha has been working in the sports-betting industry since 2014, and quickly paired his strong writing skills with a burgeoning knowledge of probability and statistics. He holds an undergraduate degree in linguistics and a Juris Doctor from the University of British Columbia.